
Ever since Federal Reserve Chairman Jerome Powell described cyclical or COVID-related elements of inflation as “transitory” (an ambiguous phrase now retired), critics repeatedly seized on year-to-year changes in price indexes as evidence that inflation was instead accelerating every month.
As I have noted before, however, the stubborn rise in year-to-year inflation—even when monthly rates slowed in the third quarter—was partly because of base effects (prices indexes were often flat or falling in the 2020 pandemic) and particularly because of compounding: If we keep adding the same monthly increase to a price index, the year-to-year change must keep moving higher. And adding new low-inflation months cannot quickly reverse the immobile 12-month average.
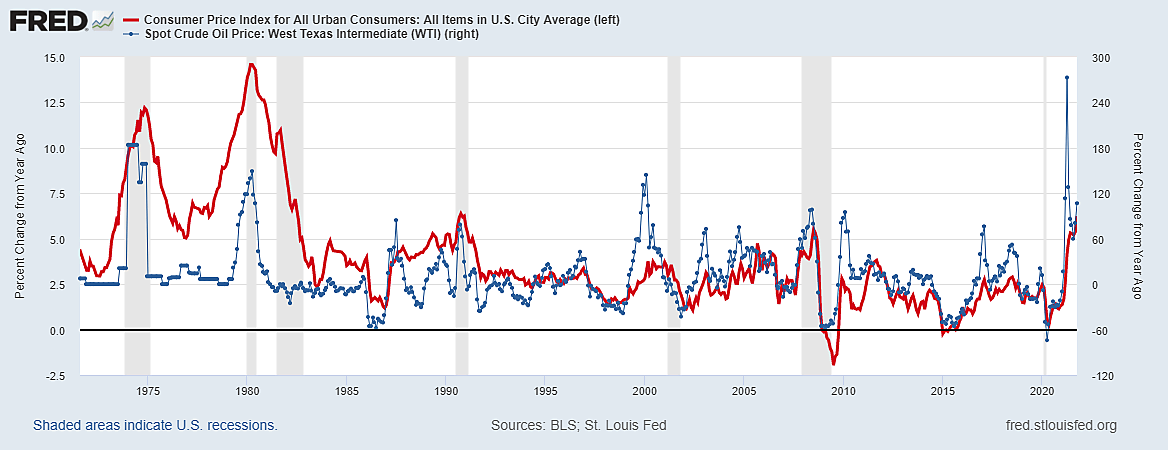
One especially important price, however, has always proved to be transitory (temporary) in the past—namely, large spikes in the global price of crude oil. As I documented last month, “year-to-year percentage changes in the CPI … invariably go up and down with year-to-year percentage changes in the price of oil. Higher oil prices also raise non-energy costs such as transportation” and energy-intensive goods.
Is that also true of the producer price index (PPI)? In a word, yes.
The Wall Street Journal writes, “The Labor Department [reported] that its producer-price index rose 9.6% in November from a year earlier, the most since records began in 2010.” On the contrary, most PPI records began in 2013. It is only the “final demand” PPI—the short blue line in the graph below—that has such a brief history.
The graph also shows a dotted black PPI line of all commodities plus a green line—which also excludes services but includes only final demand for “finished goods less food and energy.” The green line for “core” goods is also strongly correlated with oil and energy prices because energy affects the cost of transportation services and numerous energy-intensive goods.
If we exclude energy prices, the meaning of any 12-month average for the PPI for consumer goods must be cloudy since several monthly price changes since 2020 were negative. The final demand PPI for consumer goods less energy fell 6.2% in February 2020, then rose 32.1% in May before falling 19.8% last June, 7.1% in December, and 3.6% this July.
Any Producer Price Index is a measure of prices received, not prices paid. It measures prices U.S. businesses received for about 3700 commodities and 800 services. It has not been called a “wholesale price index” since 1978, and never measured price changes in the wholesale market. It is also not a gauge of business costs—since a higher cost for one business customer is often higher revenue to another business supplier. Also, producer prices are paid by governments and foreign importers, not just by U.S. businesses and consumers.
October’s headline 0.6% rise of the final demand PPI (0.3% excluding energy) included a huge 10.2% monthly rise in energy prices for export, which reflected soaring Asian demand for coal and European demand for natural gas. Higher export prices improve the terms of trade: Americans get more for less.
Since producer prices are paid not just paid by Americans or consumers, among many other reasons, the PPI is not comparable to the CPI (and certainly not a leading indicator of some future CPI). Yet the Journal speculates that, “higher-than-expected producer-price numbers suggest that consumer inflation. . . will stay elevated into 2022.” On the contrary, evidence suggests the PPI cannot predict the CPI.
The graph shows that big spikes in the year-to-year increases in producer prices for commodities (even core commodities) have very often been dominated by big spikes in the year-to-year increases in crude oil prices. What 2021 has in common with 1974, 1979, 1990, and 2008 is that those were all years in which the global price of crude oil roughly doubled on that problematic year-to-year basis. Each time, nearly everyone thought it was part of an escalating inflation that would never end unless and until somebody did something drastic. But when oil prices stopped rising—or fell in 1991, 2001, and 2009—the inflation numbers quickly slowed down, even on the sluggish year-to-year basis.
The price of West Texas Intermediate (WTI) crude oil quintupled from $16.55 a barrel in April 2020 to $81.48 in October 2021, which raised the PPI and CPI directly and indirectly. But WTI crude oil declined from a likely peak near $85 in late October to below $70 in early December. Projections are treacherous, but if oil prices stabilize or decline, the U.S. year-to-year PPI and CPI could moderate significantly by the Spring of 2022 when the low 2020 base effect will disappear.
In short, past oil price spikes also created alarming year-to-year inflation statistics, as they have this year. As the Table shows, however, that past oil price spikes rarely lasted long because they dampen demand and boost supply. Year-to-year PPI increases that peaked at 6-20% during six previous oil spikes were followed by much lower inflation rates during the same month a year later—including falling prices (deflation) in two out of six cases.
Unfortunately, because oil price spikes were repeatedly confused with lasting inflation trends, they have sometimes ended in recession when the Fed overreacted by pushing short-term interest rates above long-term interest rates.
The post Producer Prices for Goods Rise and Fall with Oil Prices appeared first on Alt-M.

